
Mobilizing Transformative Climate Action in Cities
ADELAIDE | Carbon Neutral Adelaide is our community’s shared ambition to work together and make the City of Adelaide one of the world’s first carbon neutral cities.
Mobilizing Transformative Climate Action in Cities
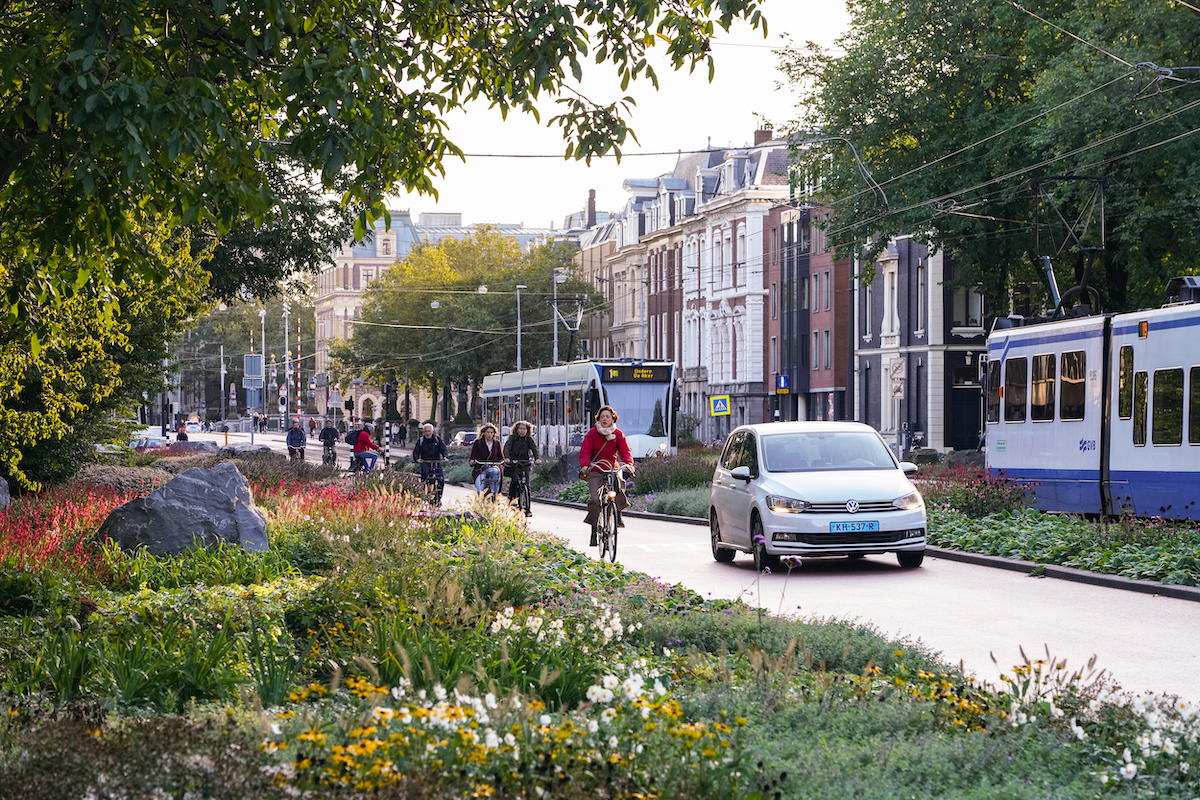
AMSTERDAM | Amsterdam’s goal is to achieve a 55% reduction in emissions by 2030, and a 95% reduction by 2050.

Mobilizing Transformative Climate Action in Cities
BOSTON | Boston’s current climate initiatives are laying the groundwork to advance its climate goals and to accelerate progress.

Mobilizing Transformative Climate Action in Cities
BOULDER | In December 2016, Boulder City Council formally adopted goals to guide Boulder’s climate action efforts.
Mobilizing Transformative Climate Action in Cities
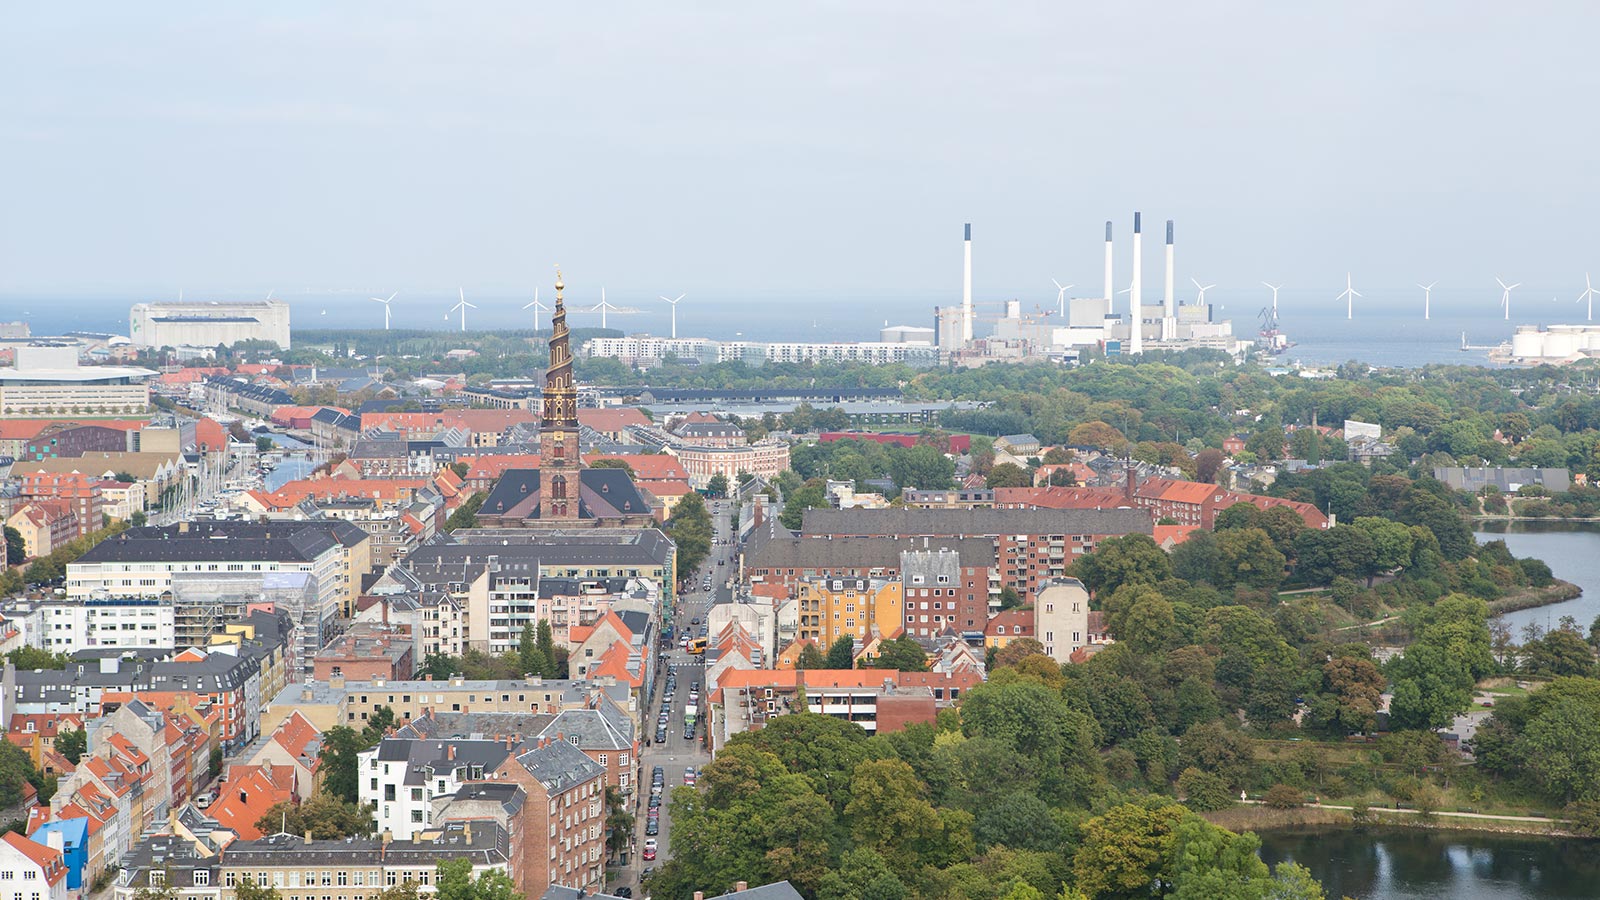
COPENHAGEN | Copenhagen has major climate ambitions, and aims to be the first carbon neutral capital in 2025.
Mobilizing Transformative Climate Action in Cities
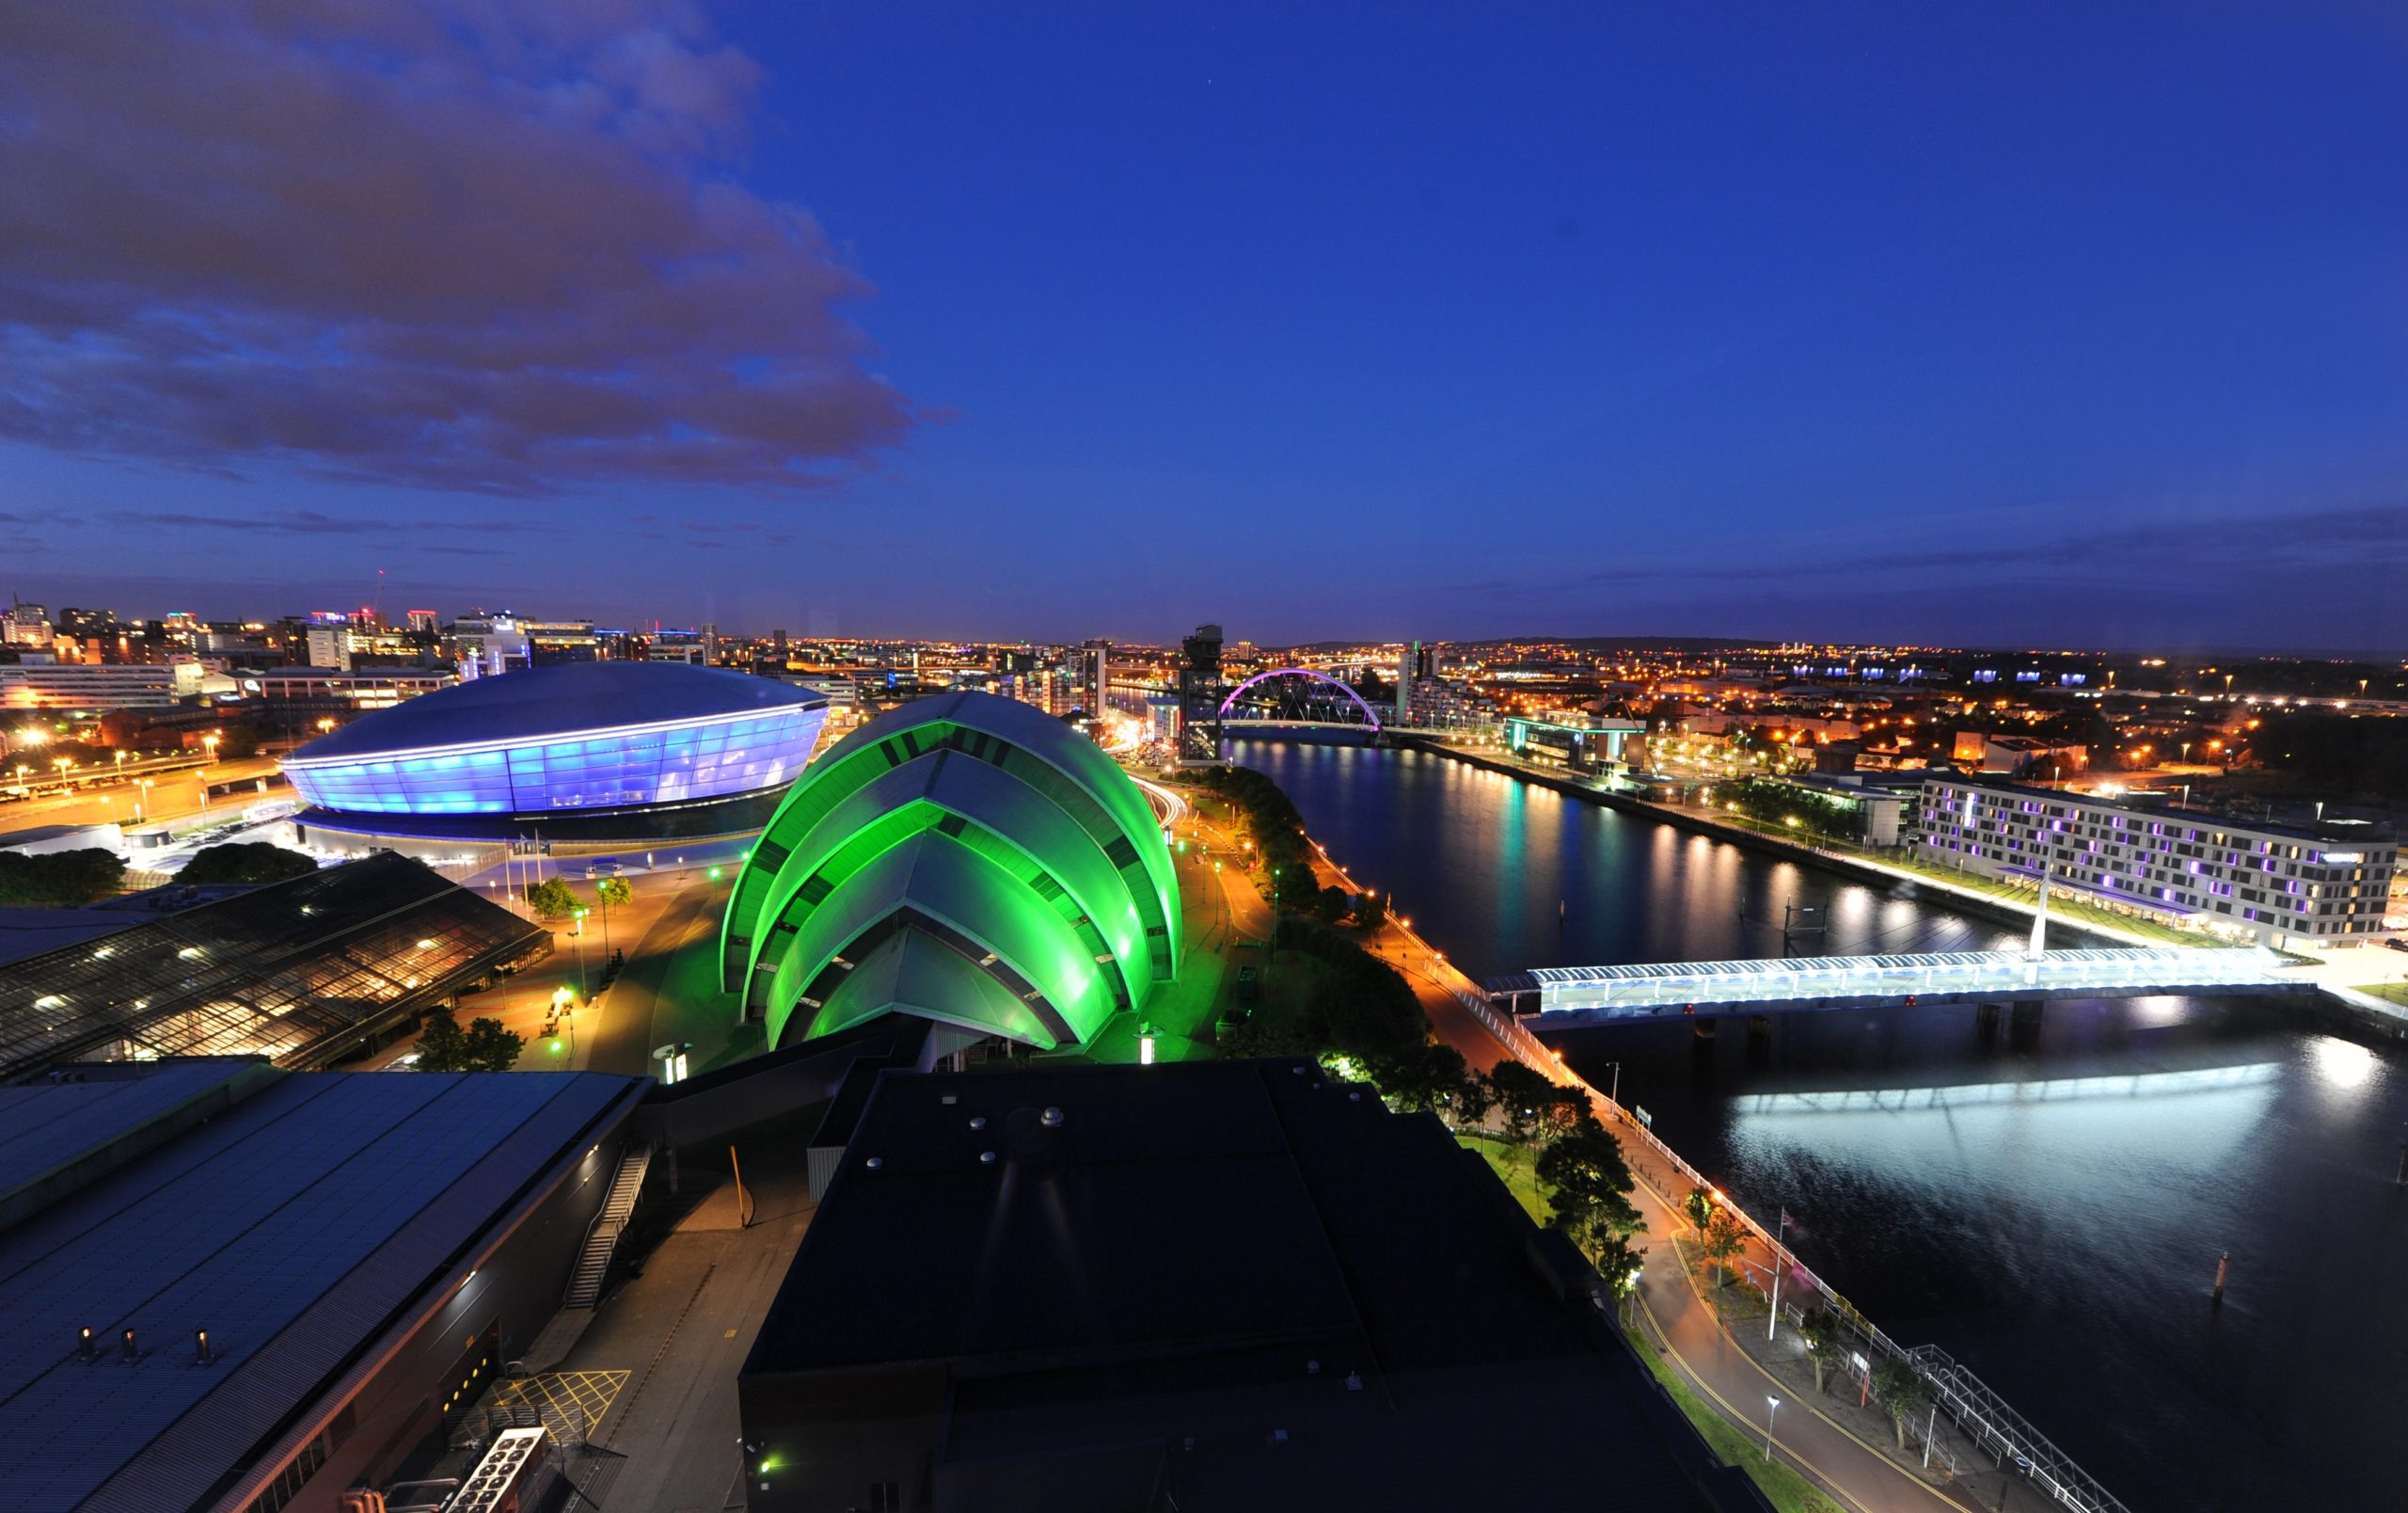
GLASGOW | Glasgow is committed to becoming a Net Zero Carbon City by 2030.
Mobilizing Transformative Climate Action in Cities
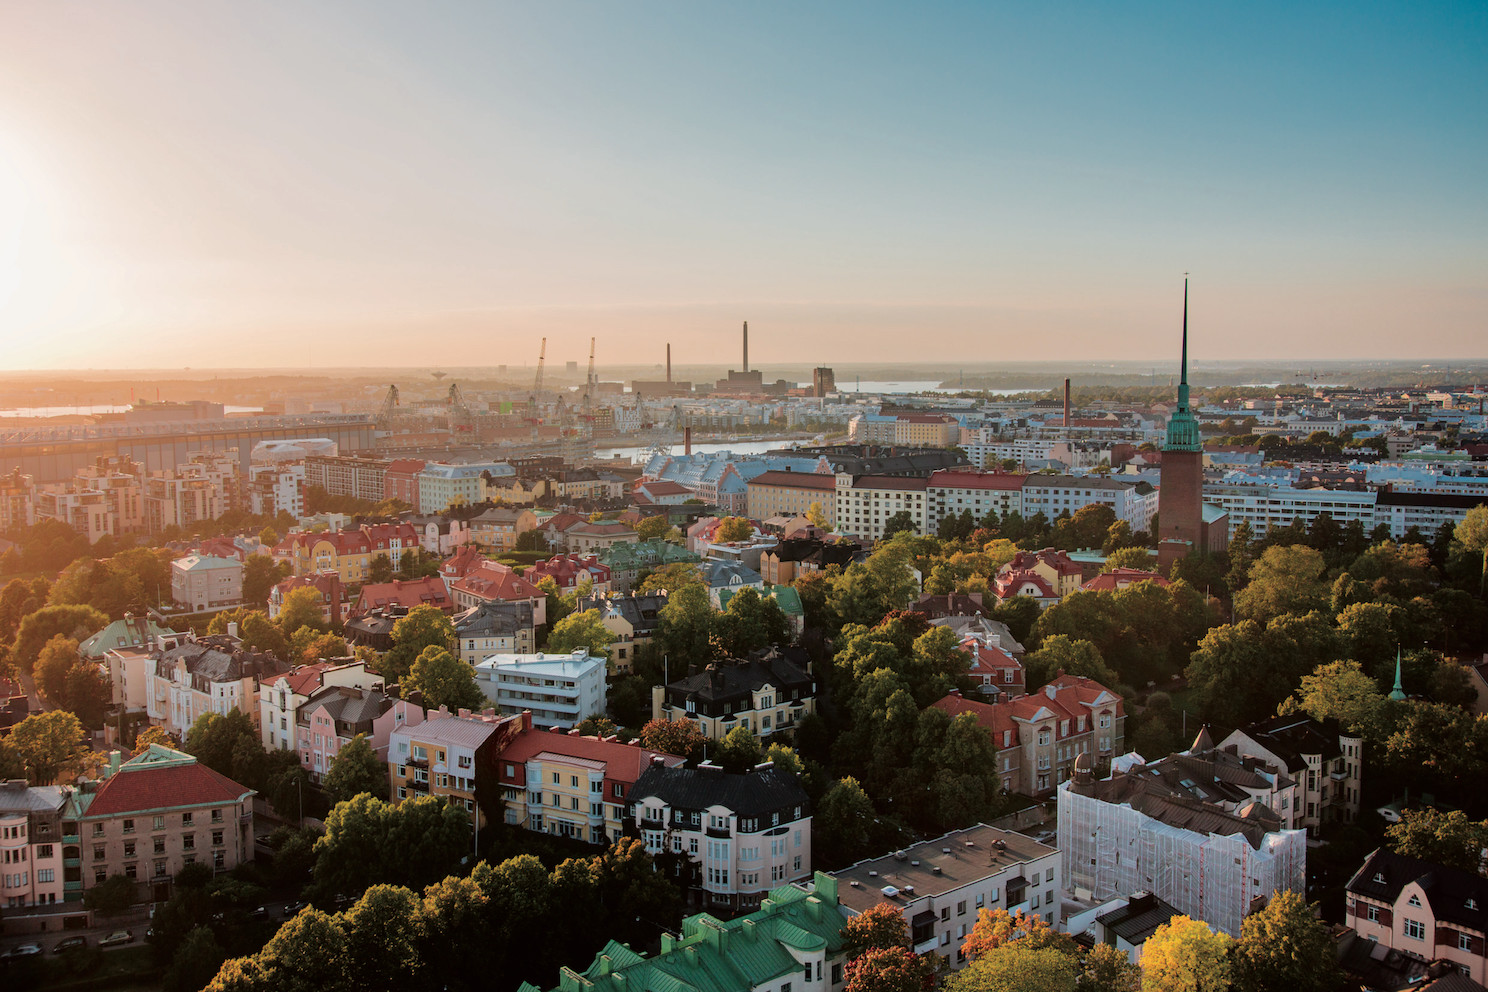
HELSINKI | The objective of Helsinki City is to make Helsinki carbon-neutral by 2030. This goal will be achieved by reducing the greenhouse gas emissions in Helsinki by 80%.

Mobilizing Transformative Climate Action in Cities
INCHEON | Incheon aims to cut emissions by 41.3% by 2030 and achieve carbon neutrality by 2045.
Mobilizing Transformative Climate Action in Cities
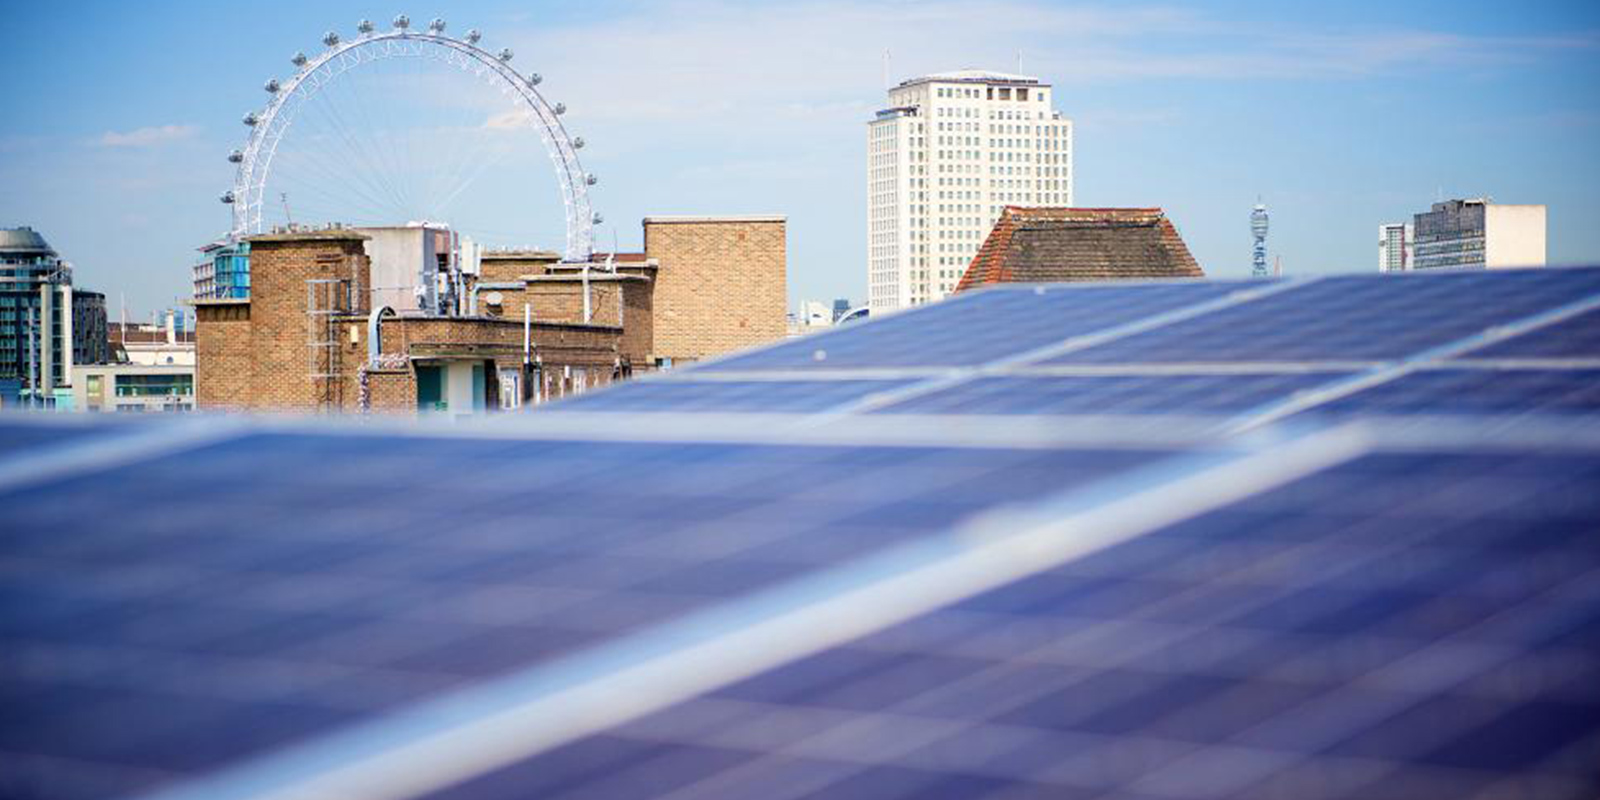
LONDON | The City of London must play its part in reducing carbon emissions. This will help meet the Paris Agreement target of keeping a global temperature rise this century below 2 degrees Celsius.
Mobilizing Transformative Climate Action in Cities
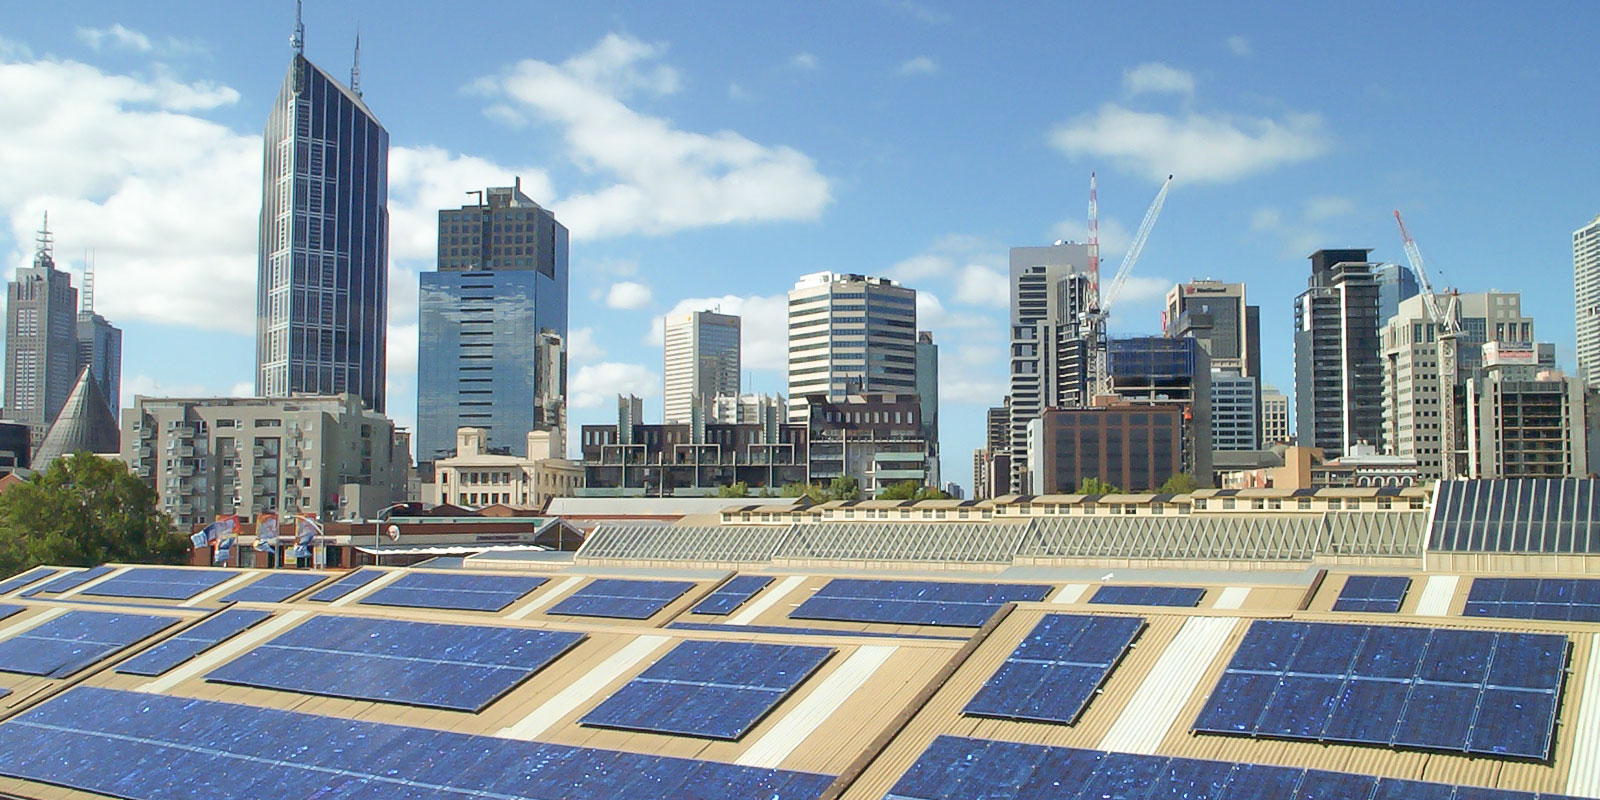
MELBOURNE | The City of Melbourne became a certified carbon neutral organisation for the first time in 2011-12.
Mobilizing Transformative Climate Action in Cities
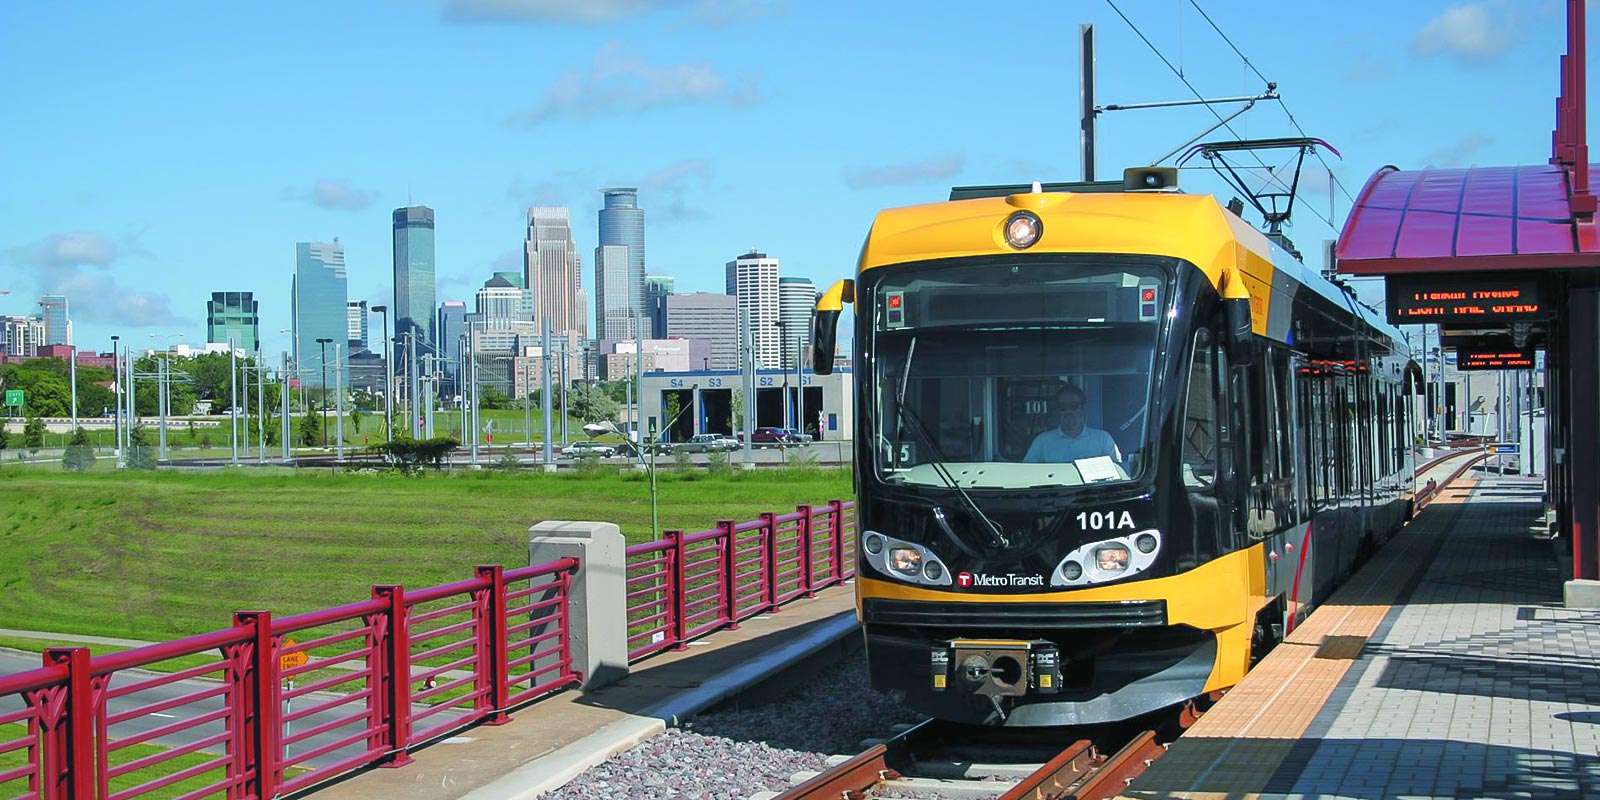
MINNEAPOLIS | Looking towards the future, the city continues to use progressive strategies to further cut carbon emissions.

Mobilizing Transformative Climate Action in Cities
NEW YORK CITY | NYC is investing over $20 billion to adapt our neighborhoods to climate change risks such as flooding, heat, and sea level rise.
Mobilizing Transformative Climate Action in Cities
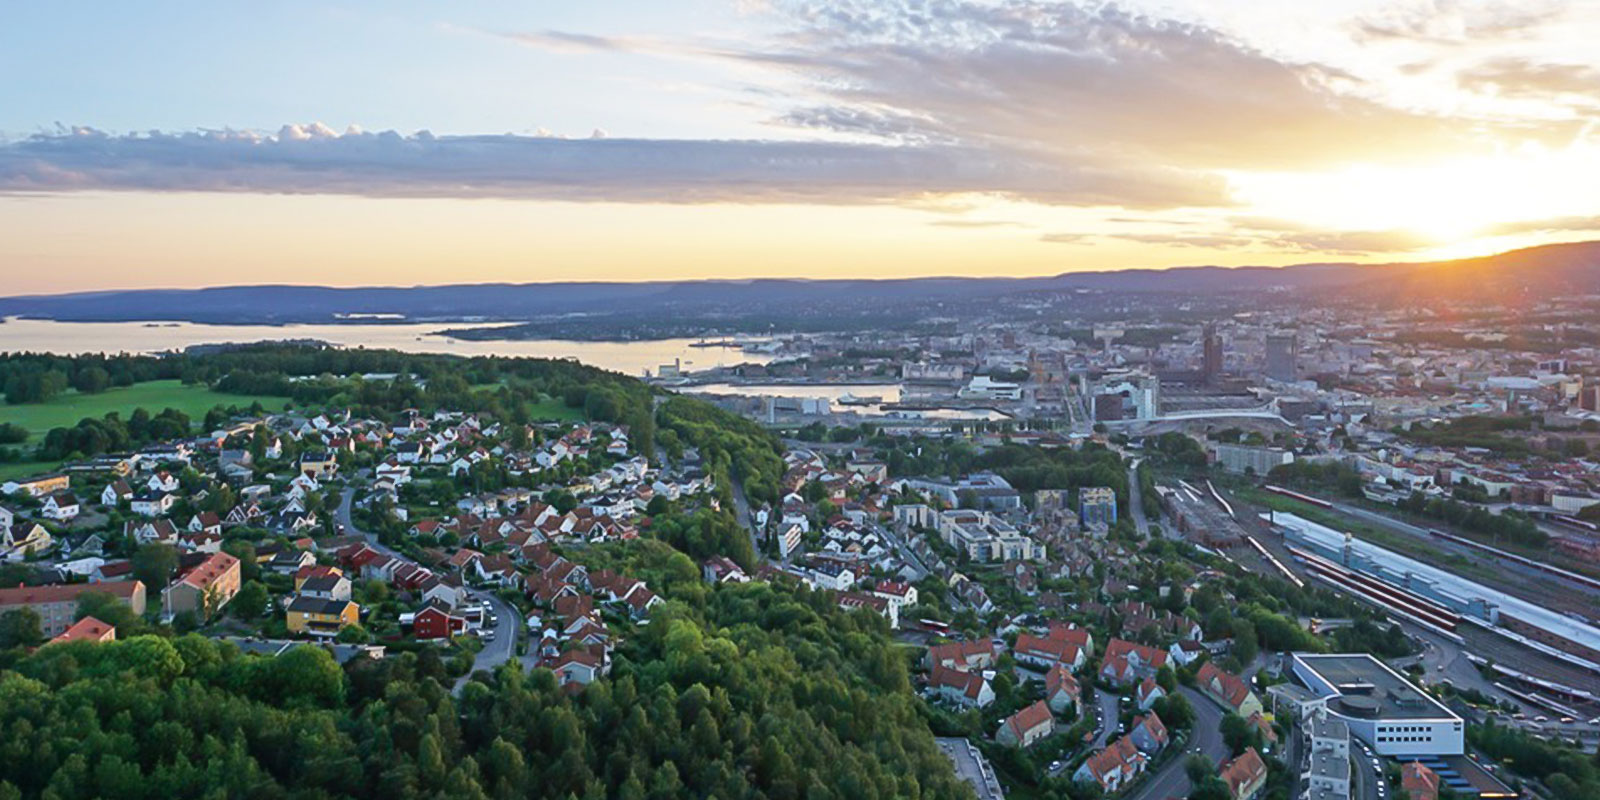
OSLO | The City of Oslo strives to be a leading agent in the transformation to a greener and more inclusive society.
Mobilizing Transformative Climate Action in Cities
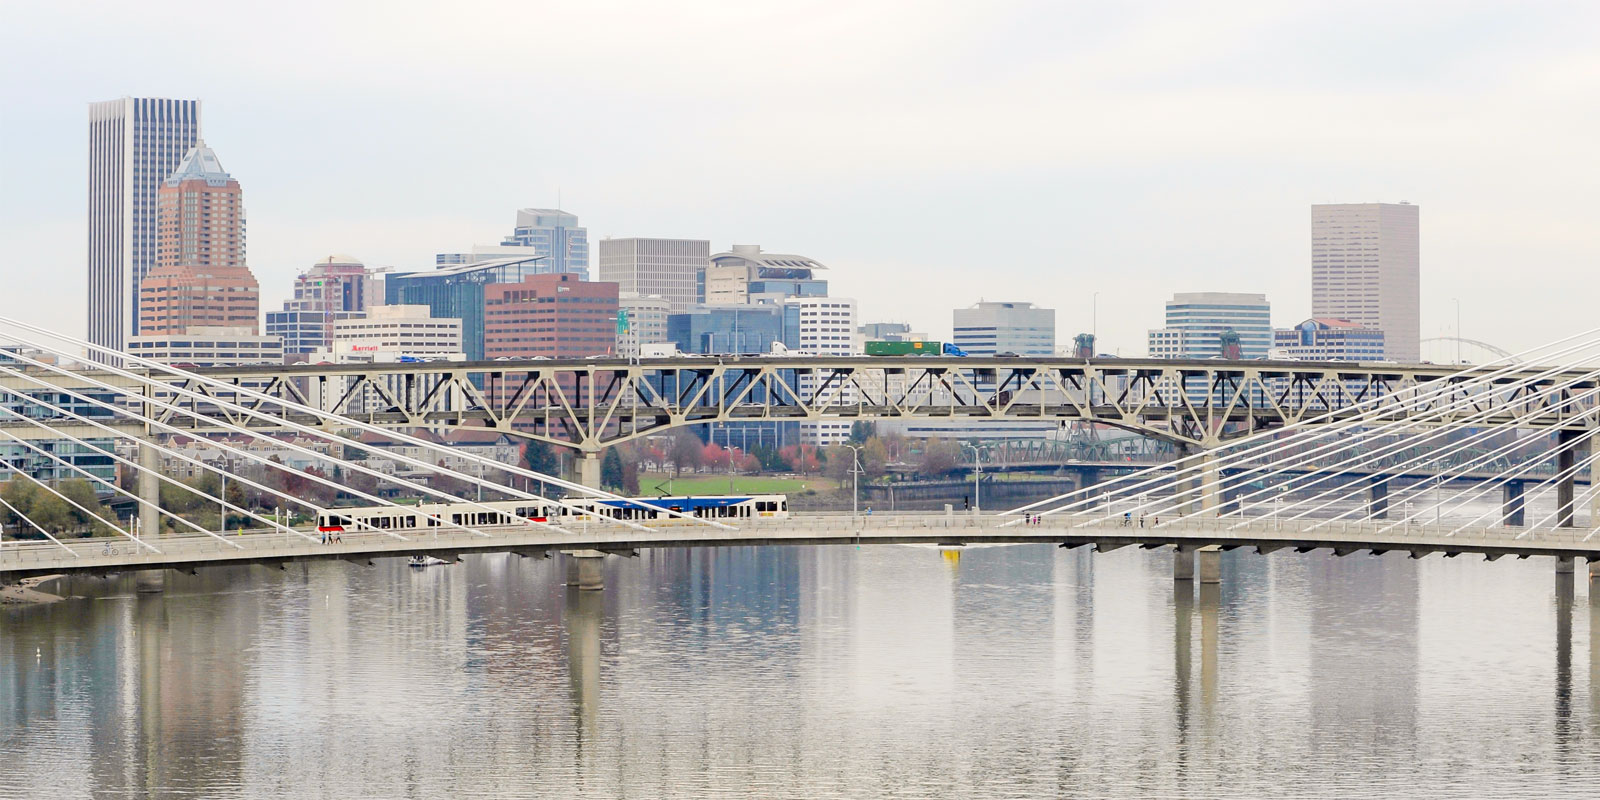
PORTLAND | Portland has addressed climate change for nearly 25 years and has steadily cut carbon emissions for more than a decade.

Mobilizing Transformative Climate Action in Cities
RIO DE JANEIRO | Rio de Janeiro was one of the first to carry out an inventory of greenhouse gas emissions at a municipal scale in 2000.
Mobilizing Transformative Climate Action in Cities
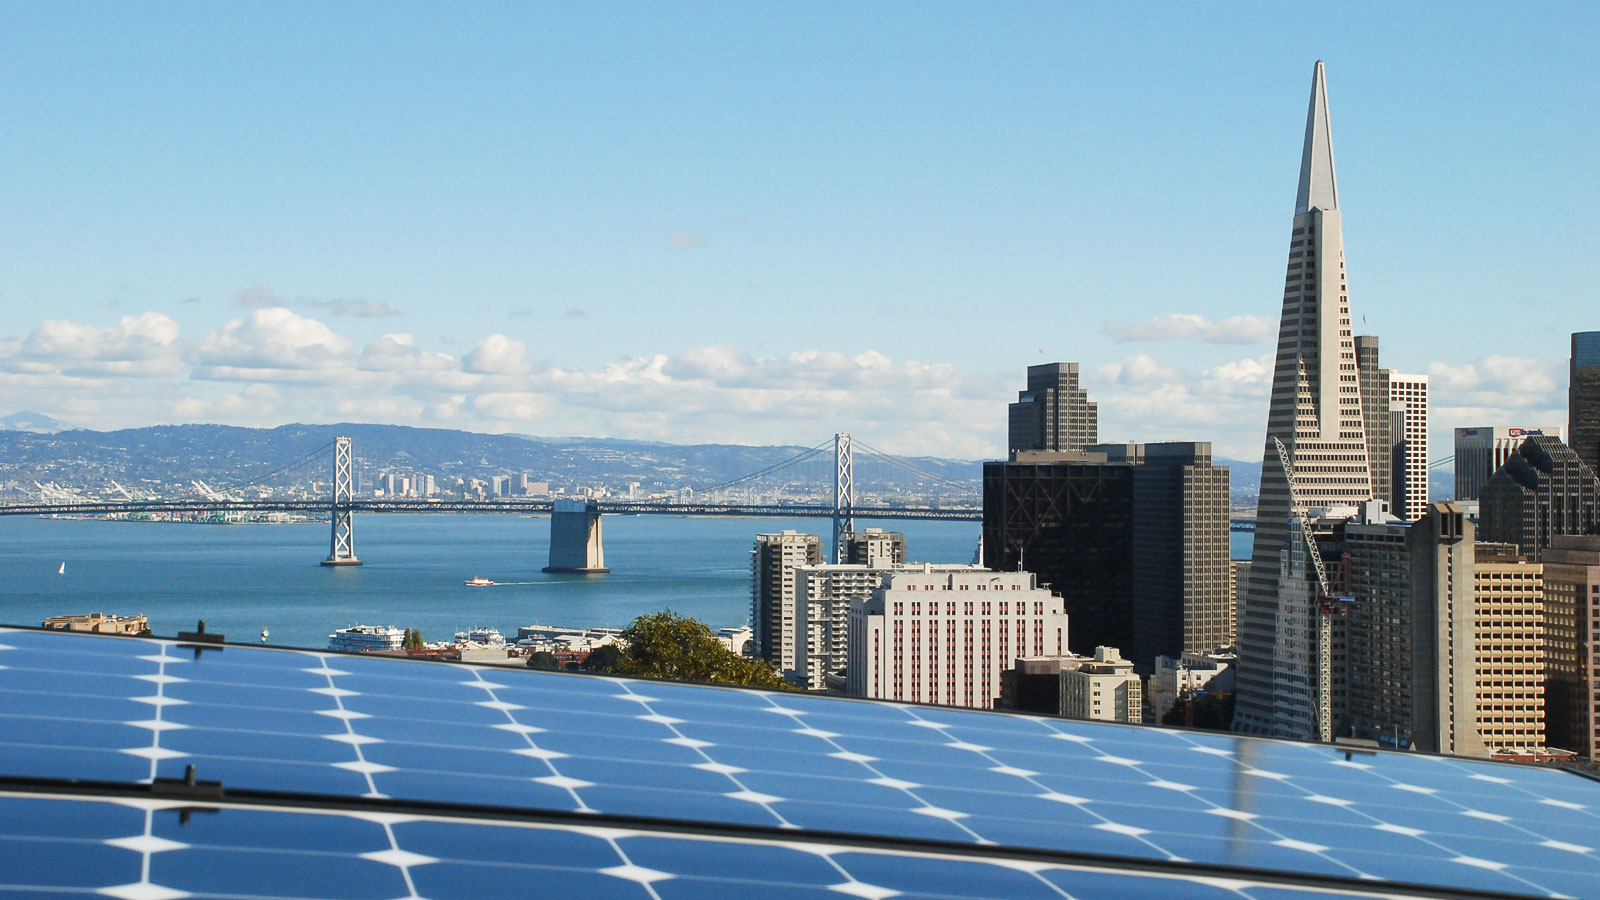
SAN FRANCISCO | San Francisco is proving that aggressive climate goals are good for the economy, the health and well being of our residents, and for the Earth.

Mobilizing Transformative Climate Action in Cities
SEATTLE | Over the last decade, Seattle has guided growth to transit-accessible urban villages, increased affordable housing, and supported leading building and energy codes.
Mobilizing Transformative Climate Action in Cities
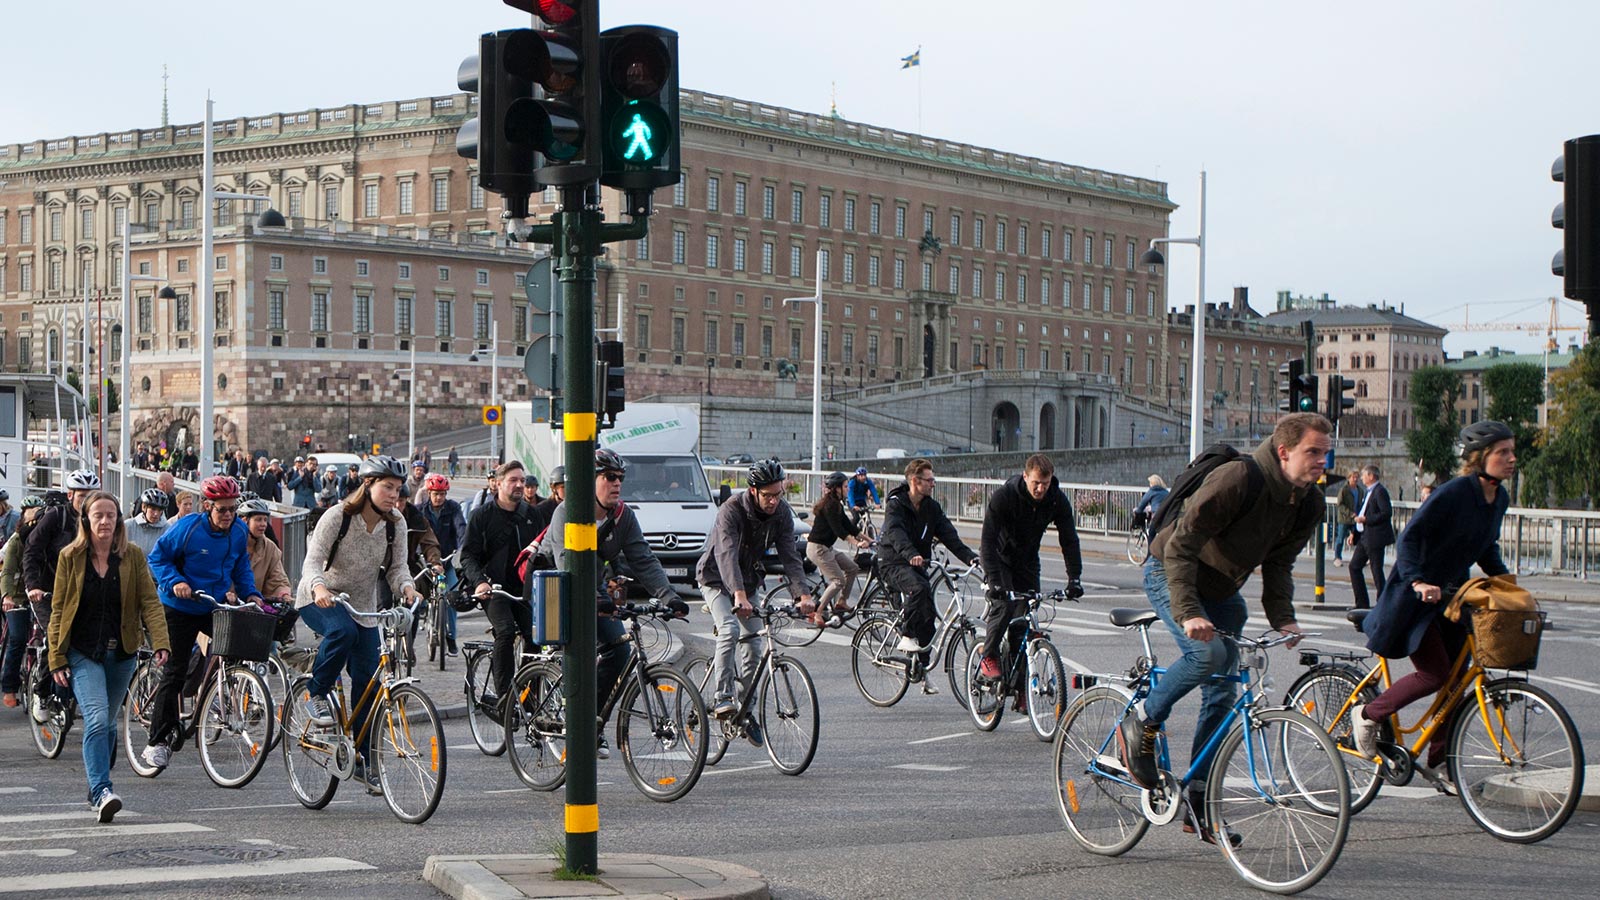
STOCKHOLM | The vision of a climate-smart Stockholm forms the basis of a strategy for a fossil-fuel free Stockholm by 2040.

Mobilizing Transformative Climate Action in Cities
SYDNEY | The city’s operations became carbon neutral in 2007 and were the first government in Australia certified as such in 2011.
Mobilizing Transformative Climate Action in Cities
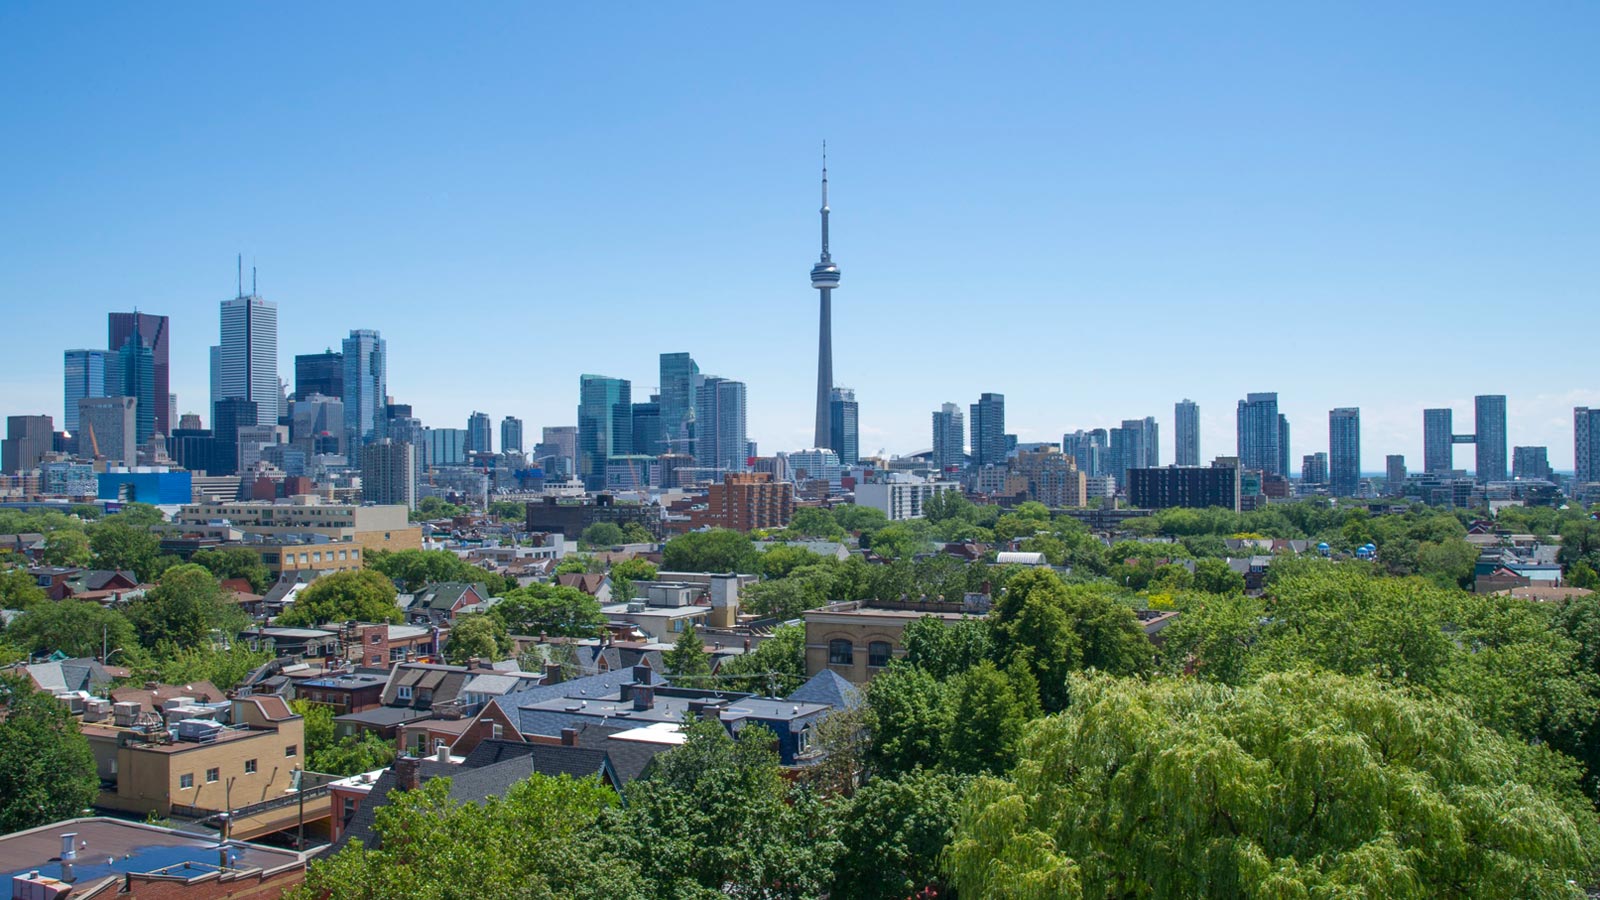
TORONTO | By 2050, 100 percent of vehicles in Toronto will use low-carbon energy; 75 per cent of trips under 5 km will be walked or cycled.

Mobilizing Transformative Climate Action in Cities
VANCOUVER | Vancouver aims to cut carbon emissions by 50% by 2030 and to prepare and respond to the impacts of climate change to build a healthy, resilient, equitable city.

Mobilizing Transformative Climate Action in Cities
WASHINGTON, DC | In December 2017, Washington, DC pledged to become carbon neutral by 2050.
Mobilizing Transformative Climate Action in Cities
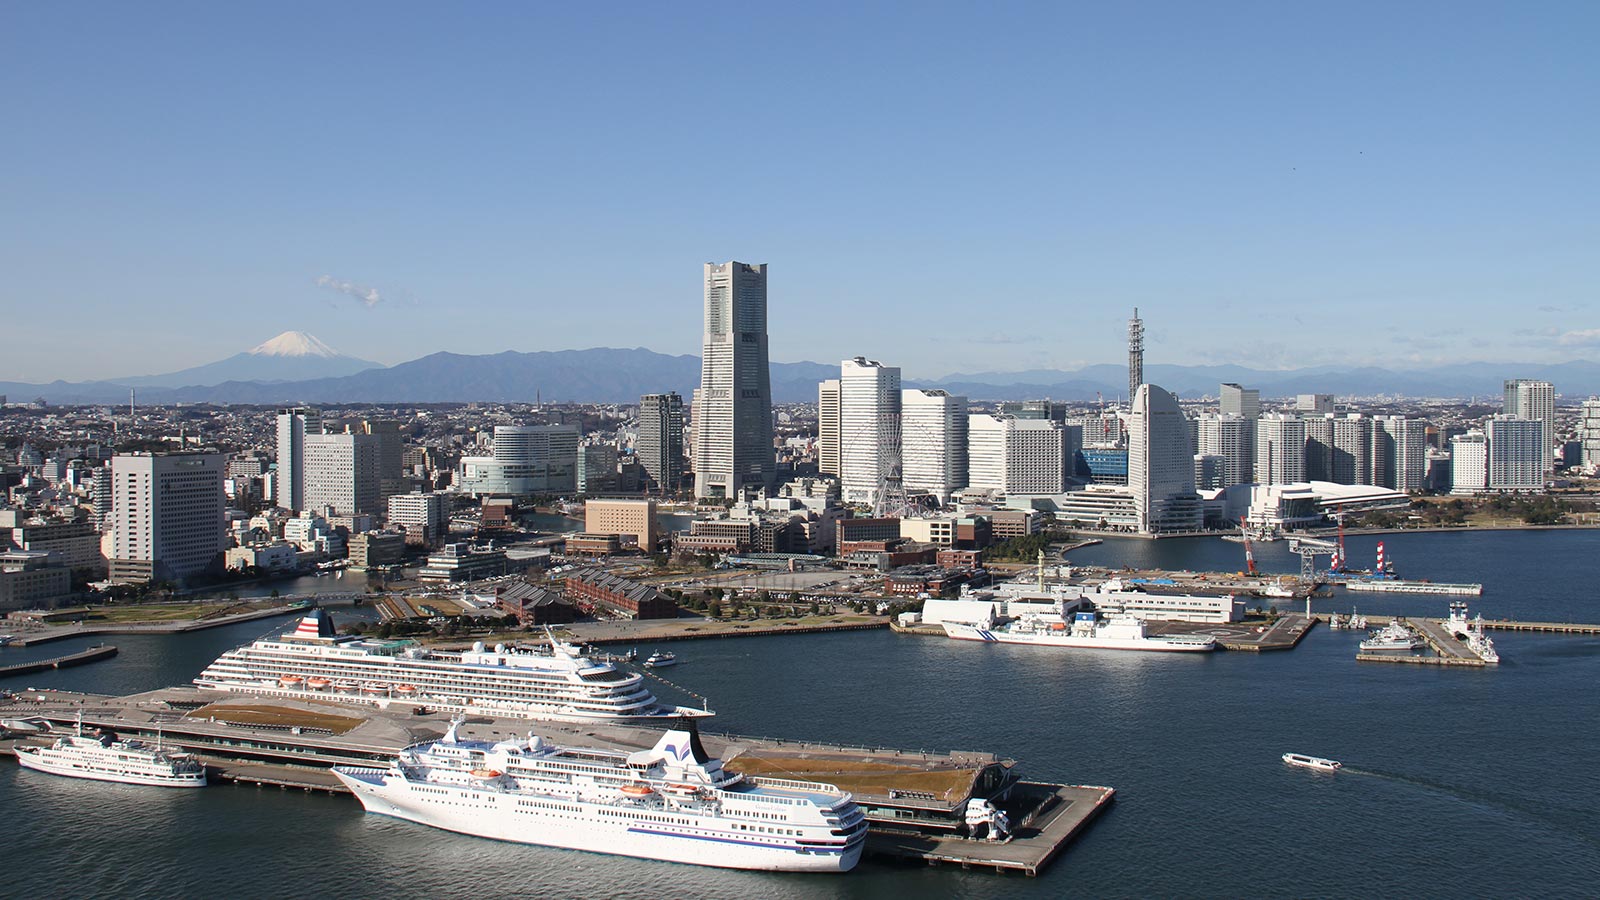
YOKOHAMA | Yokohama City is committed to address urban problems such as hyper aging society and reduction of CO2 emissions, along with the revitalization of the economy.

10 years of bold, collaborative climate action
CNCA marks key milestone towards carbon neutralityLearn More
New: Climate Justice & Built Environment in Europe
A practical guide to confront structural inequalities that hinder climate actionLearn More
New: Centering Justice in Embodied Carbon Policies
A guide and workbook for cities and communities on land use transitionsRead More